The Number That Decides Whether Your Fleet Makes Money
A rental car earns nothing standing in your lot — but it keeps costing you money the entire time: depreciation, insurance, financing, parking. That's why the single most important operational metric in this business isn't your fleet size or even your daily rate. It's fleet utilization: the percentage of available vehicle-days you actually sell.
Two operators with identical 20-car fleets and identical rates can have wildly different businesses. At 55% utilization, one is paying for seven idle cars every day. At 75%, the other funds growth from the same fleet. The difference between them is rarely luck or location — it's whether utilization is measured, watched, and managed.
This guide covers how to calculate the number, what a healthy range looks like, and seven practical levers that raise it without buying a single additional vehicle.
What Fleet Utilization Is — and the Formula
Fleet utilization is the share of your available capacity that generates revenue:
Utilization = (rented vehicle-days ÷ available vehicle-days) × 100
Ten vehicles over a 30-day month give you 300 available vehicle-days. If your vehicles were on rent for 210 of those days, you ran at 70%. Measure it monthly, and measure it three ways: for the whole fleet, per vehicle category, and per individual vehicle. The fleet-wide number tells you how the business is doing; the breakdowns tell you what to do about it.
One decision to make up front: whether days lost to maintenance count as "available." Excluding them gives you a cleaner demand signal, but track downtime separately — a car in the shop is a utilization problem wearing a different coat, and we've covered it in depth in our guide to reducing vehicle downtime.
"Fleet size is vanity, utilization is sanity. A 15-car fleet at 80% out-earns a 25-car fleet at 50% — with ten fewer cars to insure, park, and maintain."
How to Start Managing Utilization: 5 Steps
-
1
Establish your baseline
Pull the last three full months of bookings and compute utilization fleet-wide. If your booking history lives in fleet management software, this is a report, not a project; if it lives in a spreadsheet, this exercise alone justifies switching.
-
2
Break it down by category and vehicle
Fleet-wide averages hide the story. Maybe economy cars run at 90% while SUVs sit at 40%. Maybe two specific vehicles drag the whole average down. The breakdown converts a vague number into specific decisions.
-
3
Set a target range, not a single number
Pick a working band — say 70–80% — and treat both edges as signals: below the floor means capture more demand or shrink the fleet; above the ceiling means raise rates or add vehicles.
-
4
Find the patterns
Look at utilization by day of week, by season, and by location. Weekday troughs, shoulder-season dips, and one chronically overstocked branch are each an opportunity with a different fix.
-
5
Review monthly and act
Utilization only improves if someone owns the number. Put it on a monthly review, pick one lever from the list below each cycle, and measure whether it moved.
7 Ways to Improve Fleet Utilization
1. Sell every hour with 24/7 online booking
The cheapest utilization gain is demand you already have but can't capture: the customer who wanted to book at 10 pm and found a contact form. An online reservation system with live availability turns every hour of the day into selling time, and every confirmed booking is rented days added to the numerator.
2. Cut turnaround time between rentals
If cleaning, inspection, and paperwork keep a returned car off the road for a day, you're donating vehicle-days to your own process. Digital inspections, e-sign agreements, and a defined turnaround checklist can bring the gap down to hours — the same fleet suddenly has more days to sell.
3. Schedule maintenance around demand, not against it
An oil change on a Saturday in high season costs you a rentable day at peak rates; the same oil change on a low-demand Tuesday costs almost nothing. Software that shows bookings and service schedules side by side makes demand-aware maintenance the default instead of a lucky accident.
4. Price your valleys, not just your peaks
Utilization troughs are pricing information. Weekday specials, longer-rental discounts, and season-aware rates pull demand into the gaps where cars would otherwise sit. Filling a valley at a discounted rate beats an empty lot at full price every time.
5. Right-size your fleet mix
Per-category utilization tells you what your market actually rents. If compacts run hot and premium sedans sit cold, your next fleet decision isn't "more cars" — it's "different cars." Rotate chronically underused categories out and reinvest where demand is proven.
6. Rebalance across locations
Multi-location operators routinely run one branch starved of vehicles while another is oversupplied. Location-level utilization reports make imbalances visible weekly, so vehicles move to where the demand is before the season peaks, not after.
7. Retire the chronic underperformers
Every fleet has a vehicle that rarely rents but reliably costs money. Per-vehicle utilization and revenue reports identify it with data instead of anecdotes. Selling it and either replacing it with what renters want — or nothing at all — raises fleet-wide utilization on the spot.
Utilization Isn't the Whole Story: Watch Revenue per Vehicle Too
One caution before you optimize: utilization is a capacity metric, not a profit metric. You can push it up artificially by discounting so hard that every car rents — and earn less than before. That's why the operators who manage this well track utilization alongside revenue per vehicle per month. The two numbers keep each other honest.
Read them together and the picture is clear. High utilization with low revenue per vehicle means your rates are too low, or discounts are leaking into dates that would have sold anyway. Low utilization with high revenue per vehicle means you're winning premium bookings but leaving capacity unsold — a marketing and channel problem more than a pricing one. Low on both is the signal to shrink or reshape the fleet. High on both is the only version of "full lot" worth celebrating, and it's your cue to consider adding vehicles.
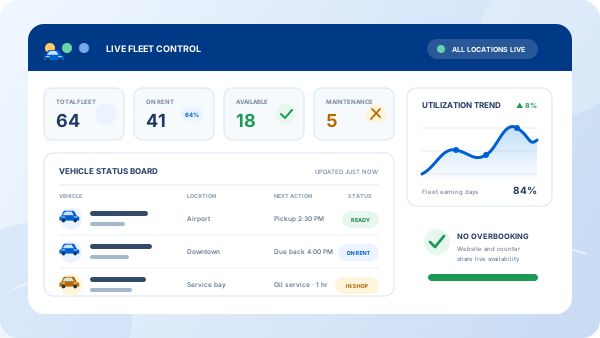
This is also the practical argument for running bookings, rates, and fleet status in one system: when the data lives together, this cross-read is a dashboard glance instead of a month-end spreadsheet project.
The Takeaway
You can't improve a number you don't measure. Compute your baseline, break it down by category and location, and work the levers: capture after-hours demand, shorten turnarounds, schedule maintenance intelligently, price the valleys, and shape the fleet around what actually rents. For the fundamentals of running the fleet side of the business, see our complete car rental fleet management guide.
Frequently Asked Questions
Many rental operators treat 70–80% as a healthy working range. Below that, too much capital sits idle; consistently above it, you're probably turning away demand and leaving no slack for maintenance or turnaround. The right target depends on your market's seasonality — the point is to measure yours, set a target, and manage toward it.
Divide rented vehicle-days by available vehicle-days over a period, then multiply by 100. Example: 10 vehicles over 30 days gives 300 available vehicle-days; if vehicles were on rent for 210 of those days, utilization is 70%. Exclude days a vehicle was out of service if you want a pure demand measure — but track those separately, because downtime is its own problem.
Yes. Utilization near 100% usually means you're turning away bookings, deferring maintenance, and rushing turnarounds — which shows up later as breakdowns, damage disputes, and lost customers. Sustained very high utilization is a signal to raise prices, adjust your fleet mix, or add vehicles, not a badge of honor.
You can compute it in a spreadsheet, but the number will always be stale and nobody will maintain it in a busy week. Fleet management software calculates utilization continuously from your actual bookings and vehicle statuses, and lets you break it down by vehicle, category, and location in seconds — which is where the actionable decisions come from.
Capture the demand you're currently missing: take bookings 24/7 through an online reservation system, and shorten the turnaround time between rentals so vehicles get back on the road faster. Both lift rented days without adding a single vehicle, and both are process changes you can make in weeks, not quarters.